IGPP Earth Relief
This grid only contains observed relief and inferred relief via altimetric gravity. You access these grids by specifying their names (earth_relief, or just relief, gebco, gebcosi and synbath) and resolution.
The available resolutions for these group of grids are:
"01d", "30m", "20m", "15m", "10m", "06m", "05m", "04m", "03m", "02m", "01m", "30s", "15s", "03s", "01s". Where the suffixd,mandsstand for arc-degrees, arc-minutes, and arc-seconds. See also the manual of remotegrid for information about the grid registrations.
On first usage, the grids are downloaded to the user ./gmt/server/... directory. On later usages, the grid(s) are loaded from that local directory.
The default color palette table (CPT) for this dataset is geo.cpt. It’s implicitly used when passing in the file name of the dataset to any grid plotting method if no CPT is explicitly specified.
Refer to earth_relief for more details about technical detail, available resolutions, sizes, version information and references.
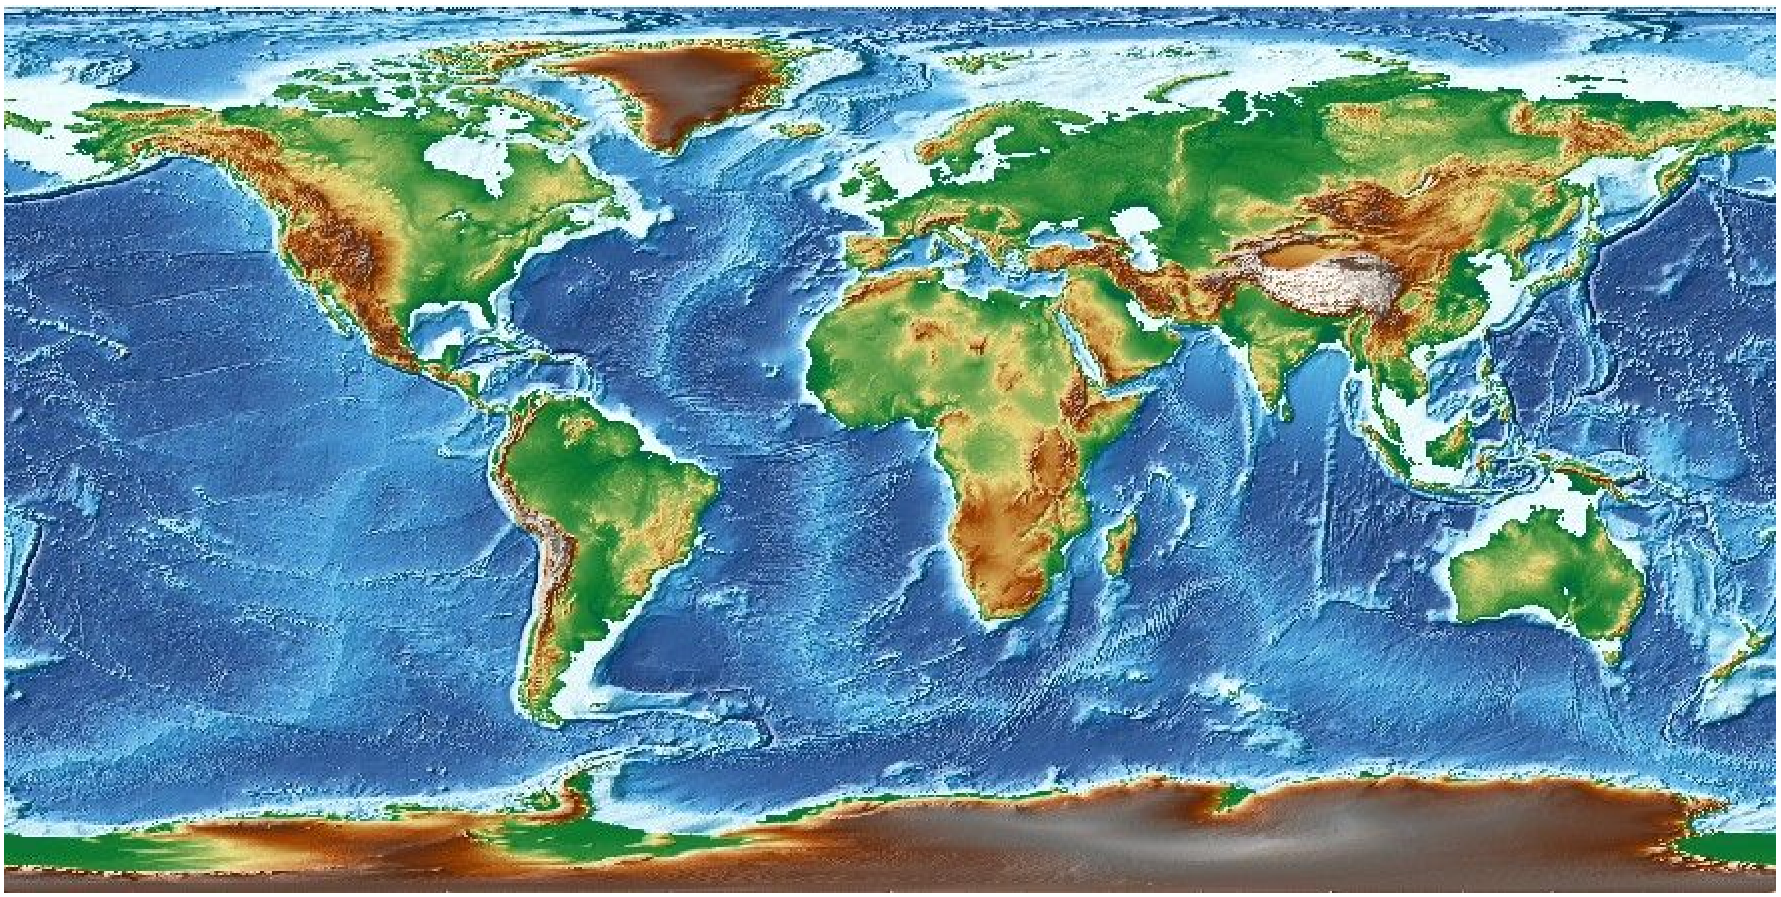
Examples
G = gmtread(remotegrid("earth_relief", res="10m"))
viz(G, shade=true)
Grids with resolutions higher than 06m are tilled to avoid download the entire dataset, which can be very big, when only a sub-region is needed. For example, this downloads a sub-region of the 1m (one arc-minute) and visualizes it.
G = grdcut(remotegrid("relief", res="1m"), region=(0,10,40, 50))
viz(G, shade=true)These docs were autogenerated using GMT: v1.33.1